

Interactions
One of the key goals in a dashboard design is to interlink analytic content items and queries together. Often, this process is complicated, convoluted and requires a high degree of technical skill.
BI Office's unique interaction capability offers end users a super simple technique for creating interactivity between different items in a slide by simply DRAWING in the links between content items in the slide designer.
These links are called interactions.
What do Interactions do exactly?
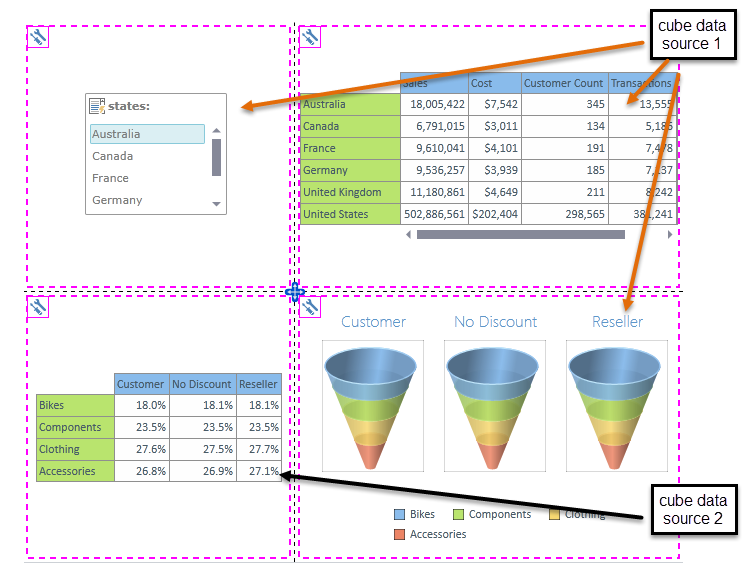
When the user sets up an interaction of the slide canvas, they effectively tell the Story Board runtime engine how to act when the user chooses the "Interaction" item on the item's context menu. The menu grabs the currently highlighted element in the source and sends it across the interaction "highway" and injects it into the target query or item on the other end of the arc. In so doing, the user effectively connects a selection made in one query with another query or item. This is not unlike a slicer, which effectively tells the target query to "slice" its data by the value currently selected in the slice itself.
The power of interactions is such that a user can effect a change in multiple queries or items simultaneously from a interaction selection made in a single source. Separately, and more powerfully, interactions can be used with Pyramid parameters to effect incredibly powerful querying scenarios. See Interactions and Parameters for more. Other examples include:
- Global slicers and Variables : Global slicers are dashboard specific slicers built to interconnect values across slides. Once built, a global slice's value is made to "interact" with target queries on a slide when it is changed.
- Interactive Content: Web Panels, text and button assets can all receive interactions enabling their content to be dynamically changed based on the incoming interaction triggers made by the user.
Adding Interactions
Once content has been placed on the slide in the chosen layout, users go to the interactions ribbon tab and click on one of the interaction tools.
Then click on a SOURCE panel and draw an arrowed line to one or more target panel(s). The interaction "wizard" will then react according to a variety of datasource combinations, as described above in "order of operations"
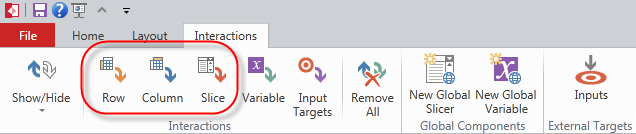
Interaction Types
There are 6 types of interactions in the Story Board:
- gray: The first is an automated interaction, drawn in between content items from the same underlying query or report. It cannot be edited or removed.
- yellow: The second is a manually applied "ROW" interaction, denoting interactions that will be driven from the row axis selections in the source query.
- blue: The third is a manually applied "COLUMN" interaction, denoting interactions that will be driven from the column axis selections in the source query.
- red: The fourth is a manually applied "SLICER" interaction, denoting interactions that will be driven from the slicer selections. These interactions are available from "local" and "Global Slicers'".
- green: The fifth is a manually applied "VARIABLES" interaction, denoting interactions that will be driven from the slicer selections. These interactions are available from "Global Variables".
- purple : The sixth is a manually applied "INPUT TARGET" interaction, denoting "targeted" interactions that will be driven from parameters placed in an External URL loader.
Each type of interaction can evoke 3 types of responses depending on the source and the target.
- Data interactions - are generated with all interaction types from analytic content to other analytic content (query to query). Data interactions involve changing the target query with input from the source.
- Synchronized Interactions - allows a user to synchronize changes in hierarchy selections across two or more queries in the dashboard. When a user changes the hierarchy selections in one component’s query, the change is mirrored by one or more other component queries in the exact same way.
- Content interactions - are generated with all row, column and slicer interaction types only from analytic content to other analytic content and general assets (buttons, text and web panels). Content interactions involve changing target item values with input from the source. These "values" refer to text string values and display conditions.
Data Interactions: Order of Operations for Interactions between Queries
The Story Board engine makes the following calculus for data interactions:
- If the source hierarchy is found in the data model / cube of the target hierarchy, the interaction logic is made without prompt.
- It then tries to determine position of the best location for the selected hierarchy and its element in the target query.
- If the hierarchy does NOT appear on the rows or the columns, the source element is used on the filter axis (like a normal slicer)
- If the hierarchy appears as a non-parameterized selection on either the rows or the columns, the interaction will throw an error.
- If the hierarchy appears as a parameterized selection on the rows or the columns or in a custom element definition, the source element is used as the parameter input. See Interactions and Parameters for more.
- It then tries to determine position of the best location for the selected hierarchy and its element in the target query.
- If the source hierarchy is NOT found in the data model / cube of the target hierarchy (i.e. different models or different databases), the interaction logic is made through a dialog wizard.
- The wizard will ask the user to designate the relevant target hierarchy in the target model and then ask the user to build the "value translation" mechanism to be used to porting the source element into the target element.
- It then tries to determine position of the best location for the selected hierarchy and its element in the target query.
- If the hierarchy does NOT appear on the rows or the columns, the source element is used on the filter axis (like a normal slicer)
- If the hierarchy appears as a non-parameterized selection on either the rows or the columns, the interaction will throw an error.
- If the hierarchy appears as a parameterized selection on the rows or the columns or in a custom element definition, the source element is used as the parameter input. See Interactions and Parameters for more.
- It then tries to determine position of the best location for the selected hierarchy and its element in the target query.
- The wizard will ask the user to designate the relevant target hierarchy in the target model and then ask the user to build the "value translation" mechanism to be used to porting the source element into the target element.
Content Interactions: Non-data interactions
Content Interactions are designed to create effects in targets other than the classic data interactions described above. They are generated when a user creates an interaction between any analytic content and other content types like assets where the outcome is to generate dynamic text content or conditional displays of content.
- Dynamic Text and Image: used mainly to drive dynamic text boxes, dynamic graphics (infographics) or dynamic URL's, content interactivity captures a user's interactions and changes the way things are displayed or the way buttons and web panels behave based on that user's selections in the runtime.
- Conditional Display: used to control what reporting components appear on screen, conditional display is used to hide, show and change content in runtime based on a user's interactive input.
See content interactions for more.
Home |
Table of Contents |
Index |
User Community
Pyramid Analytics © 2011-2022